PostGIS MVT Part 1: Basics
In this blog post, we’ll walk through the process of setting up a Postgres Database containing geospacial data that will be served by a FastAPI App as Mapbox Vector Tiles (MVT) via PostGIS ST_AsMVT. Finally, we’ll build a frontend in Vue.js to consume the MVT tiles and display them on a map.
By the end of this post, you’ll have a fully functional web mapping application that leverages the power of PostGIS MVT and FastAPI on the backend, and Vue.js on the frontend.
In case you want to jump right in, checkout the code here.
Why should you do this?
- Its fun!
- Simplicity: It can reduce the complexity of your application, by shifting boilerplate backend code to your (existing) postgres database
- Faster rendering: Vector tiles are designed to be rendered quickly, which can improve the performance of web applications.
- Interoperability: PostGIS MVT is an open standard that can be used with a wide variety of mapping libraries and platforms, which makes it easy to integrate with other tools and technologies.
Introduction
PostGIS is an open-source spatial database extension for PostgreSQL that allows you to store and manage geospatial data. With PostGIS, you can store points, lines, and polygons, and perform various spatial operations such as distance calculation, intersection, and buffering.
MVT stands for Mapbox Vector Tiles, which is a compact binary format for transmitting geospatial data over the web. MVT tiles can be used to display map data in real-time, with the ability to zoom and pan without requiring additional server requests. MVT is designed to work with web mapping libraries like Mapbox GL JS, Leaflet, and OpenLayers, and is a popular choice for building fast and interactive web maps.
In combination, PostGIS and MVT provide a powerful platform for serving geospatial data on the web. By using PostGIS to manage your geospatial data and MVT to transmit it, you can create high-performance web mapping applications that are both fast and flexible.
Preparing the data
First of all you need a fully operational PostgreSQL database cluter with the PostGIS extension installed. A comprehensive guide on how to install these can be found here and here.
Create a database with PostGIS:
CREATE DATABASE mydb;
-- This needs to be executed in mydb
CREATE EXTENSION postgis;
Next, choose some data you want to display on your map. You can choose whatever data you want. In this example we are using OSM buildings data, that can be aquired at geofabrik.
You can load the data into the database by using the command line tool osm2pgsql like this (if you run postgres locally):
osm2pgsql -d mydb <your-osm-file>.osm.pbfLast but not least create and populate a table, you want to consume the data from. For example with:
CREATE TABLE postgis_mvt_source_mercator AS
  SELECT
    osm_id as id,
    name,
    building,
    way as geom
  FROM planet_osm_polygon;
Note that the geometry in this table needs to be in the Web Mercator projection (EPSG: 3857)!
Creating a FastAPI app that serves the data
FastAPI is a modern and fast web framework for building APIs with Python. We’ll be using FastAPI to serve the geospatial data just loaded in the postgis_mvt_source_mercator table as MVT. It will define just one endpoint. You can do with by adding the following to your app.py:
@app.get("/mvt/{table_name}/{z}/{x}/{y}.mvt", response_class=Response)
async def get_mvt(table_name: str, z: int, x: int, y: int) -> Response:
    """
    Get MVT data for a specific table and tile coordinates.
    """
    conn = psycopg2.connect(
        host=db_host,
        port=db_port,
        dbname=db_name,
        user=db_user,
        password=db_password
    )

    # Construct the SQL query to fetch the MVT data
    query = f"""
        SELECT ST_AsMVT(q, '{table_name}', 4096, 'geom')
        FROM (
            SELECT id, ST_AsMVTGeom(
                geom,
                ST_TileEnvelope({z}, {x}, {y}),
                4096,
                256,
                true
            ) AS geom
            FROM {table_name}
            WHERE ST_Intersects(
                geom,
                ST_TileEnvelope({z}, {x}, {y})
            )
        ) AS q
    """

    with conn.cursor() as cur:
        cur.execute(query)
        result = cur.fetchone()[0]
        if result is None:
            response = Response()
        else:
            response = Response(bytes(result), media_type="application/x-protobuf")
        response.headers["Access-Control-Allow-Origin"] = "*"
        return response
The endpoint has the path mvt/{table_name}/{z}/{x}/{y} that we will later consume in our frontend.
The whole magic happens in the SQL query. We use the ST_AsMVT and ST_AsMVTGeom to transform the geometry column to the coordinate space of a MVT and returning it in addition to its features (here just id) as a binary representation. The ST_TileEnvelope generates a rectangular polygon that represents the geographic extent of a tile in the XYZ tile system. The tile is identified by its zoom level (Z) and its XY index in the tile grid at that level.
By using ST_TileEnvelope() in conjunction with ST_AsMVTGeom() and ST_AsMVT(), we can generate MVT tiles on the fly from our geospatial data based on the tile coordinates requested by a web mapping application.
In order to consume the data later on, make sure to define approproate CORS (Cross-Origin Resource Sharing) rules, by using the FastAPI CORSMiddleware. You can do this like this:
from fastapi.middleware.cors import CORSMiddleware

app = FastAPI()

origins = [
    "http://localhost:5173",
]

app.add_middleware(
    CORSMiddleware,
    allow_origins=origins,
    allow_credentials=True,
    allow_methods=["*"],
    allow_headers=["*"],
)
Configure this to fit the needs of your application.
Note that also the response header, defined as response.headers["Access-Control-Allow-Origin"] = "*" above, might need some tweaking to fit the requirements of you application.
The full example of this webservice can be found here
Creating the frontend
Last but not least, let’s create the frontend. We will be using Vue.js and OpenLayers to display the Mapbox Vector Tiles (MVT) generated by the FastAPI backend. Vue.js is a popular JavaScript framework for building user interfaces, while OpenLayers is an open-source JavaScript library for displaying maps and geospatial data in web applications.
We’ll be creating a Vue.js component that initializes an OpenLayers map and loads the MVT tiles from the FastAPI backend using a VectorTileLayer.
In this section the focus lies on the Map component, the full Vue.js app can be found here.
Let’s have a look at the script section of the Map component:
<script setup lang="ts">
// imports
onMounted(() => {
var vtLayer = new VectorTileLayer({
declutter: false,
source: new VectorTileSource({
format: new MVT(),
url: 'http://localhost:8000/mvt/postgis_mvt_source_mercator/{z}/{x}/{y}.mvt',
}),
renderMode: 'vector',
style: new Style({
stroke: new Stroke({
color: 'blue',
width: 1
}),
fill: new Fill({
color: 'rgba(0, 0, 255, 0.4)'
})
})
});
const map = new Map({
target: 'map',
layers: [
new TileLayer({
source: new OSM(),
}),
vtLayer,
],
view: new View({
center: fromLonLat([8.6821, 50.1109]),
zoom: 13,
}),
})
});
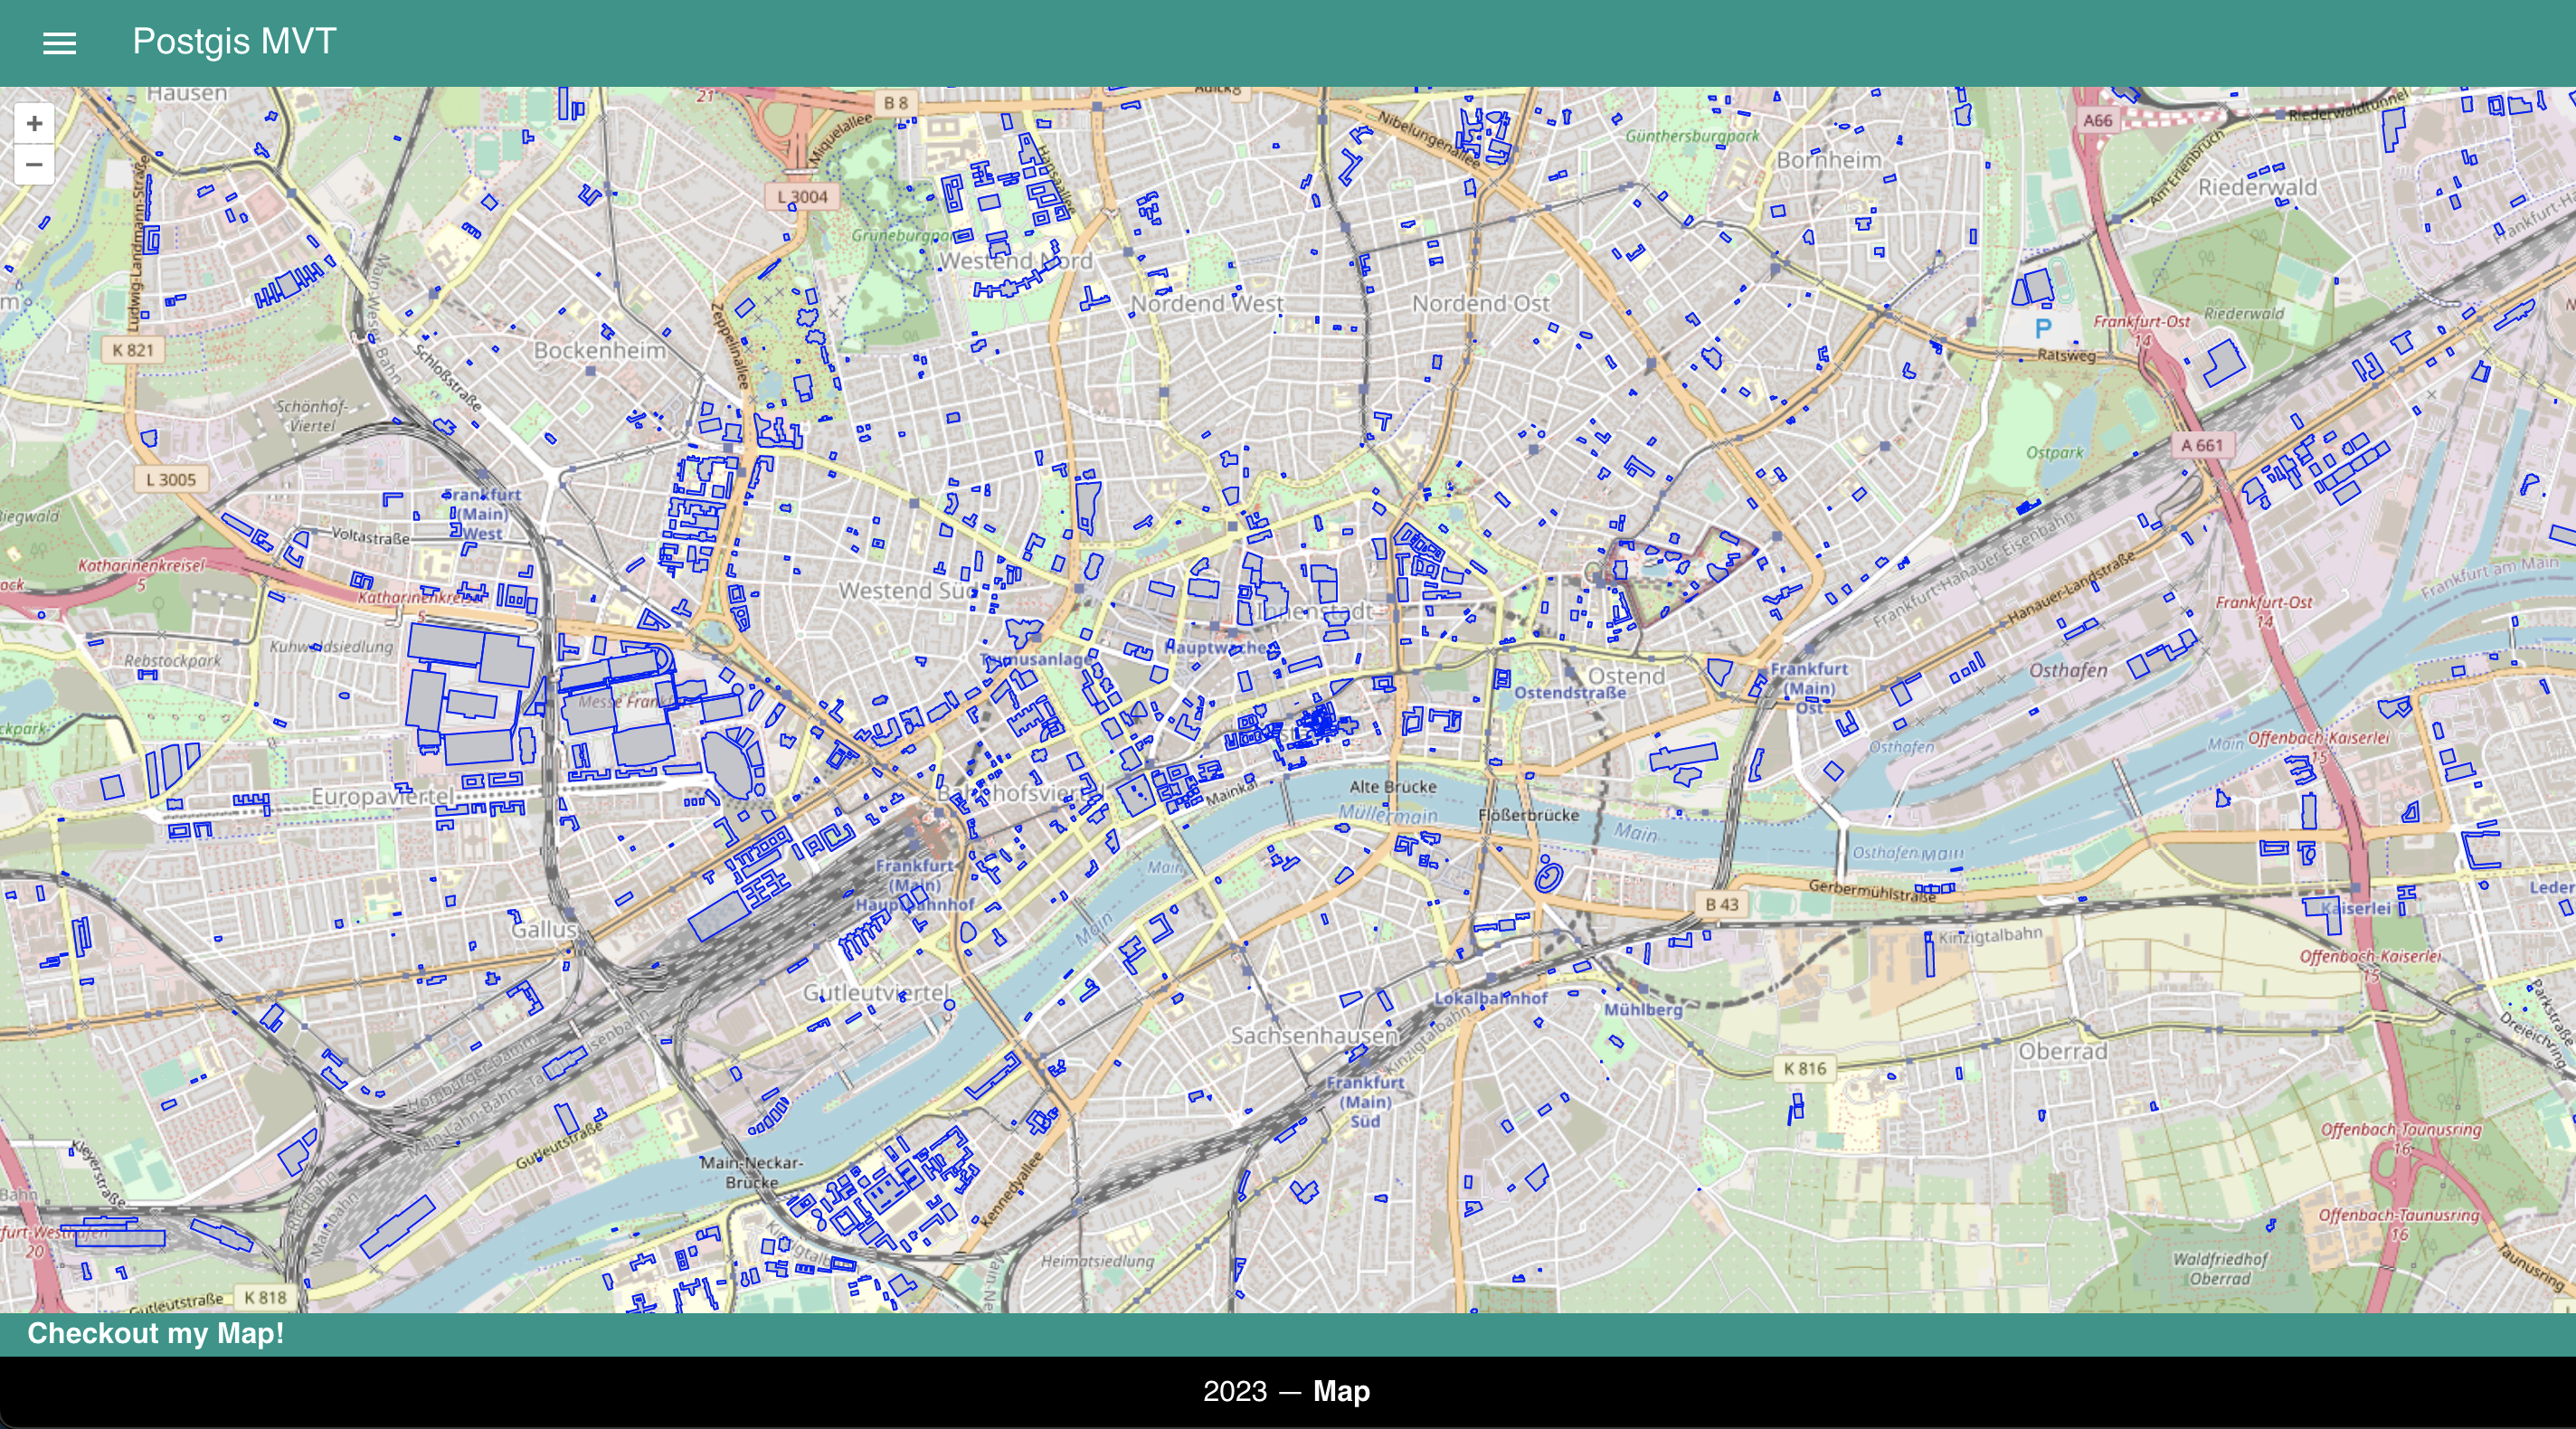
</script>There is not much going on here besides defining the Map with a basic TileLayer coming from OSM and setting the Viewpoint to center Frankfurt am Main at (8.6821, 50.1109).
The Map class is the central class that manages the display of a map on a web page. It provides methods for creating and adding layers to the map, setting the view and projection of the map, and handling user interactions such as panning and zooming. In this example, we created a new TileLayer instance and passed it an OSM source. The OSM source will fetch tiles from the default OpenStreetMap tile server and display them on the map. This leaves us with a basic map centered around Frankfurt and its surroundings.
On top of that we defined a VectorTileLayer vtlayer, that gets its content from our FastAPI backend by defining a new VectorTileSource requesting vector tiles from the above created endpoint and rendering them on the map using the OpenLayers vector renderer. You add a Style of your liking to this layer by changing the Stroke and Fill objects.
In the end you should get a webapp similar to this:
Wrapup
In this blog post, we have explored the process of serving geospacial data stored in PostGIS as MVT with FastAPI and consuming it in a Vue.js application with OpenLayers.
Although it may not be a solution for every production setup, it is definitely worth checking out for hobby or small projects, since it can reduce the amount of infrastructure and/or code you need to render various layers. It is also fun to explore the capabilities of PostGIS as extremly versatile tool for geospacial data storage and manipulation.
I will explore some more advanced topics and use cases in the future, so stay tuned, in case you are interested in this topic.
Until then have nice day. 👋