PostGIS MVT Part 2: Events and interactions
In the previous blog post, we delved into the basics of setting up a mapping solution using PostGIS MVT, FastAPI, and Vue.js. I showed you how to prepare the data, create a FastAPI REST server to serve MVT tiles, and develop a frontend that consumes and displays this data using Vue.js. Now, it’s time to take our mapping application to the next level.
In this follow-up post, we will explore advanced techniques to make our map even more interactive and visually appealing. I will demonstrate how to add click events to our map and modify vector tiles fetched from our PostgreSQL database. Specifically, we will use OpenStreetMap (OSM) building data to create a dynamic map that allows users to interact with the buildings and view metadata based on their building type. Additionally, we will showcase how to aggregate all the buildings within the current map view and display the aggregated data in a responsive bar chart.
By the end of this tutorial, you will have a comprehensive understanding of how to enhance your PostGIS MVT-based mapping application with interactive features and dynamic data visualization. So, let’s dive in and elevate your GIS and web mapping skills!
The code can be found here.
Custom MVT styling
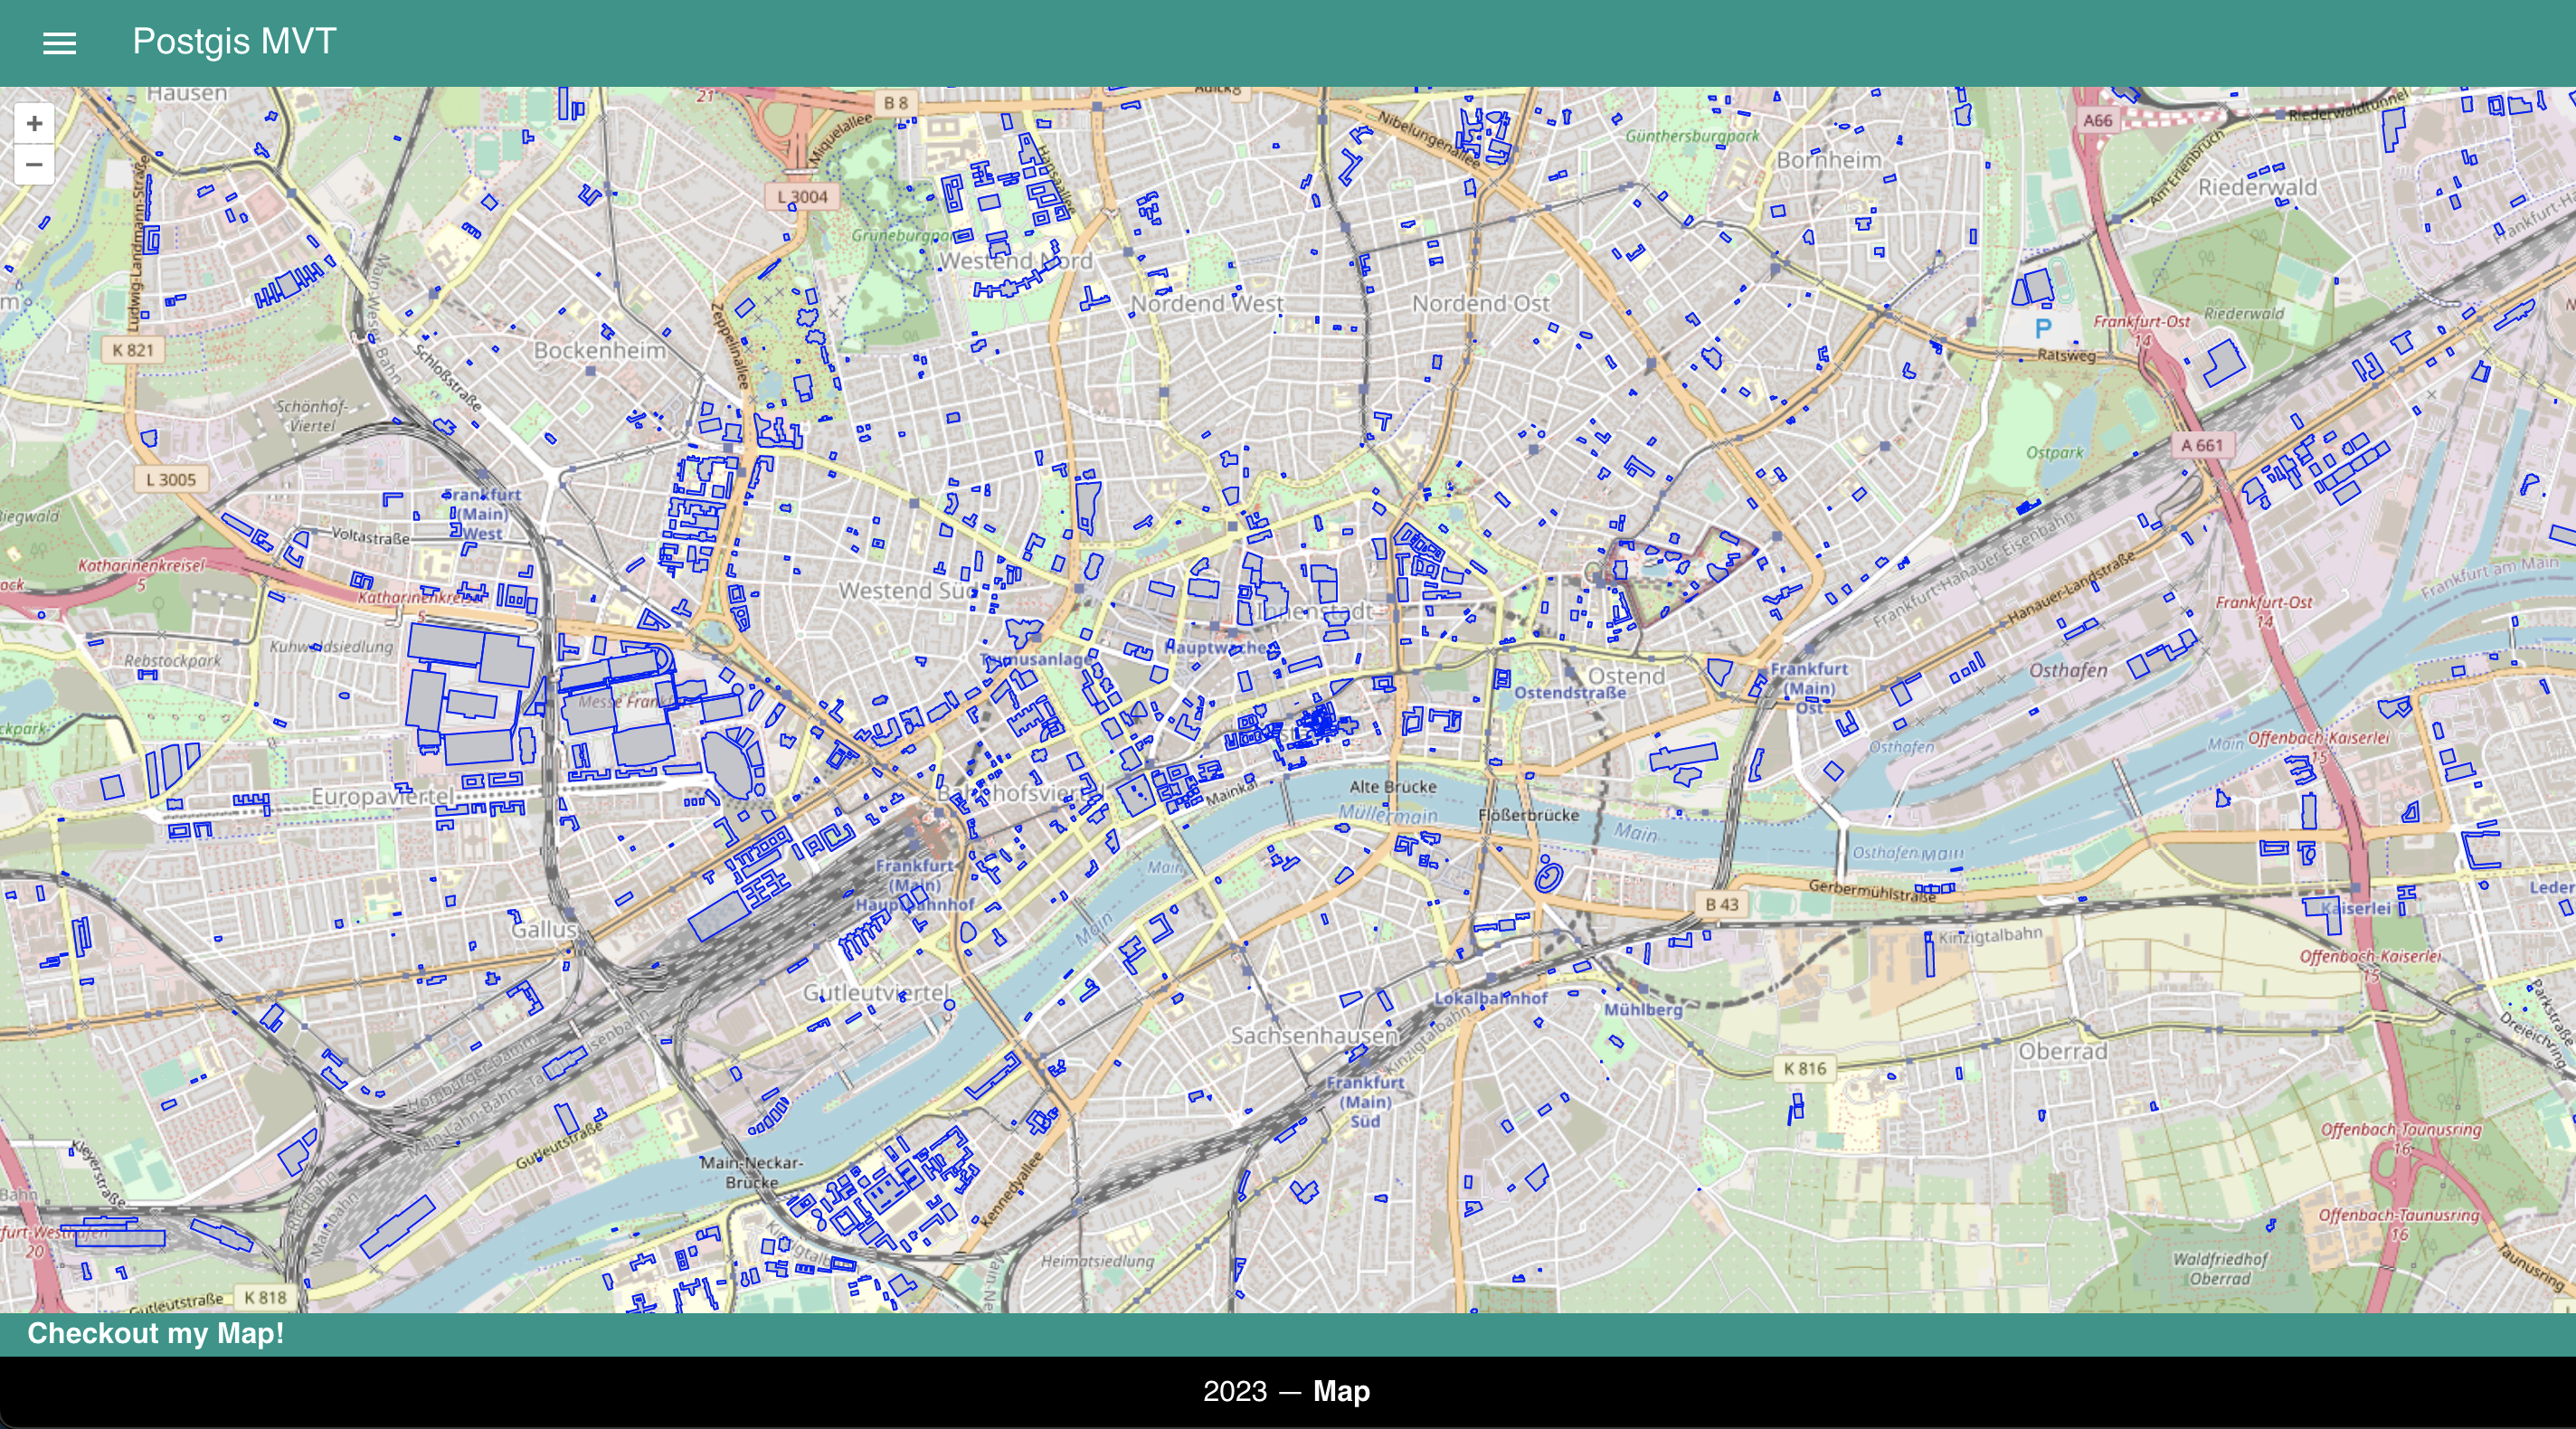
First of all, let us give the mapbox vector tyles a custom styling depending on a certain attribute they are having. Remember our application looked like this when we stopped the last time:
 The data we are using is still the OSM buildings dataset. It has the following schema:
| osm_id | name | building | geom |
|---|---|---|---|
| 143258352 | Altes Amtsgericht | yes | … |
| 106938171 | Augustiner Kloster | yes | … |
| 161483967 | Aumühle (Gärtnerei) | greenhouse | … |
In order to adjust the styling, we need to do the following in our VectorTileLayer
var vtLayer = new VectorTileLayer({
declutter: false,
source: new VectorTileSource({
format: new MVT(),
url: `http://${host.value}:${port.value}/api/v1/mvt/${table.value}/{z}/{x}/{y}.mvt`,
}),
renderMode: 'vector',
style: (feature) => {
const building = feature.get('building');
let color = 'rgba(176, 196, 222, 0.4)';
let width = 1;
let strokeColor = 'blue';
if (building === 'industrial') {
color = 'rgba(255, 192, 192, 0.4)';
width = 1;
strokeColor = 'red';
}
else if (building === 'commercial' || building === 'retail') {
color = 'rgba(192, 255, 192, 0.4)';
width = 1;
strokeColor = 'green';
}
return new Style({
stroke: new Stroke({
color: strokeColor,
width: width
}),
fill: new Fill({
color: color
})
});
}
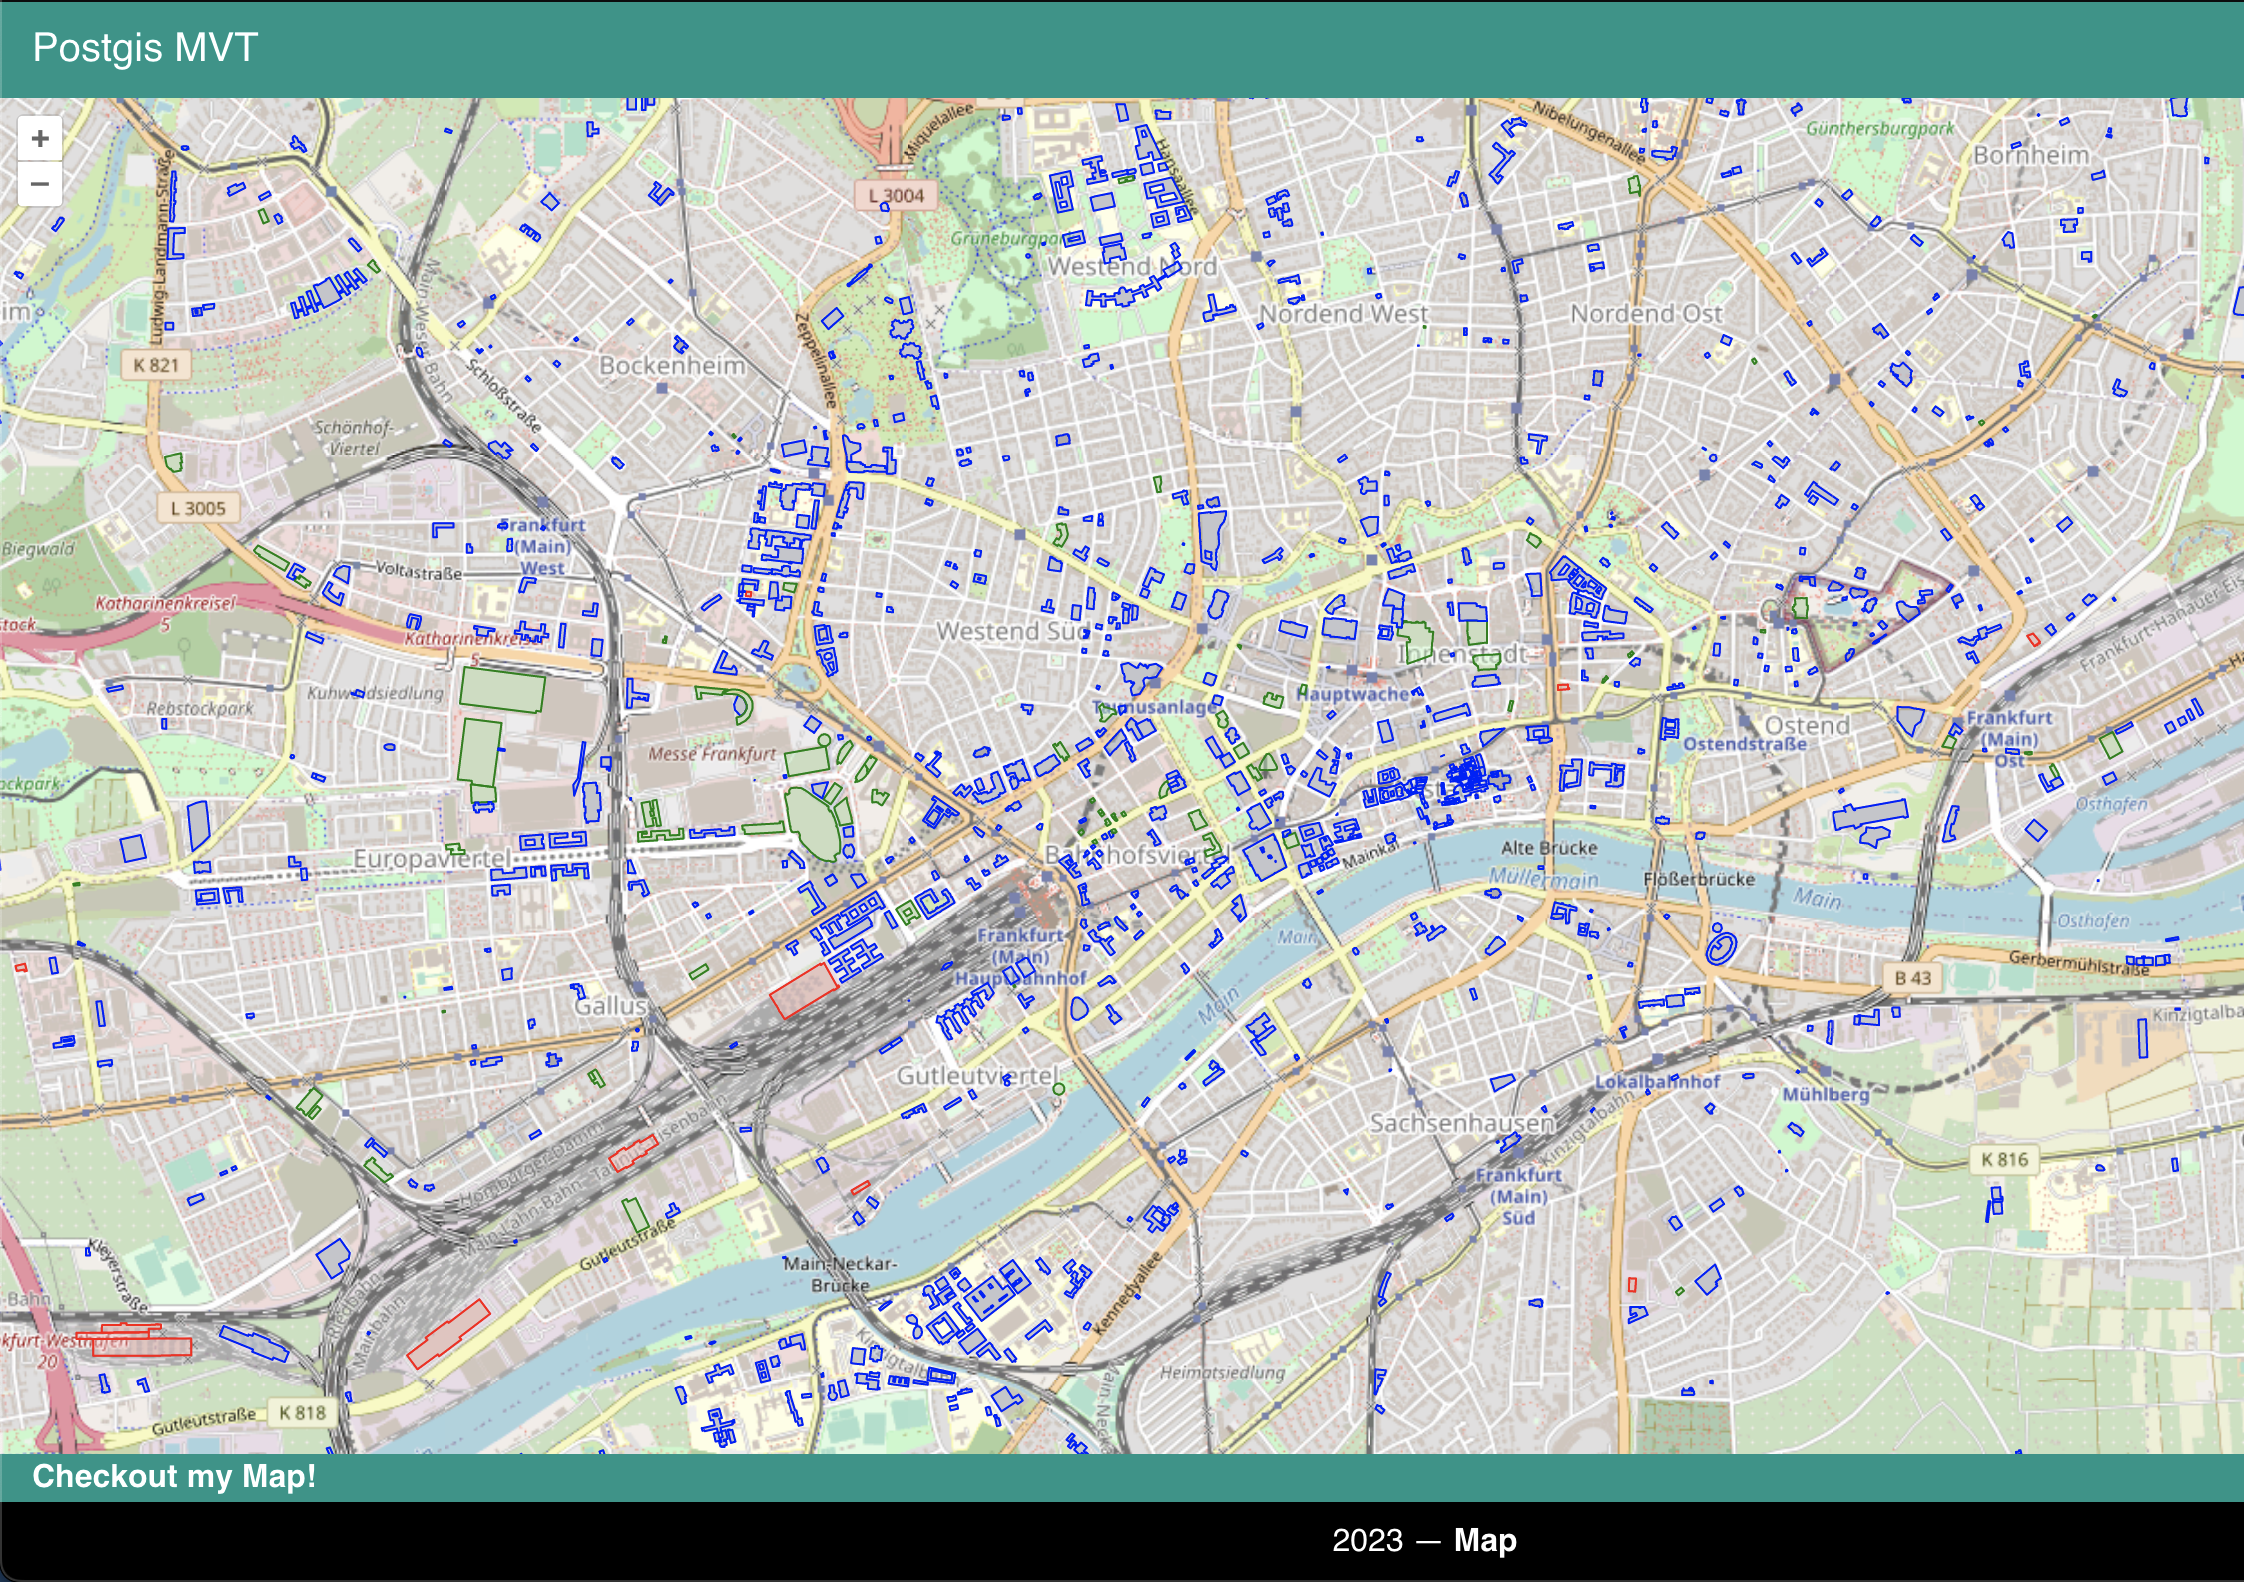
});As you can see, we adjust the styling depending on the building attribute. The default is blue as before. For industrial its red and commercial is green. So we can directely access the attributes in an anonymous function within the style and the return a new Style object.
The result should look like this:
Click events
Now we will investigate on how to use click event with Postgis MVT. First of all we will add a sidebar to our app:
<h2>Selected Building</h2>
<li class="no-bullet">Building Name: </li>
<li class="no-bullet">Building Type: </li>
<hr>
This will add a section to the sidebar where the reactive variables buildingName and buildingType is displayed. In order to fill these variables we need to add the follwing to our script section:
const buildingName = ref('Click on a building');
const buildingType = ref('Click on a building');

map.on('click', function(evt) {
  map.forEachFeatureAtPixel(evt.pixel, function(feature, layer) {
    buildingType.value = feature.get('building');
    buildingName.value = feature.get('name');
  });
});
Here we add a new onClick event to the map where we use the forEachFeatureAtPixel function. The forEachFeatureAtPixel function is a method provided by the OpenLayers library, which is used to iterate over features (such as points, lines, or polygons) present at a specific pixel location on the map.
It takes two arguments:
- pixel: The pixel location on the map, usually obtained from a user interaction event (e.g., click or mousemove).
- callback: A function that is executed for each feature found at the pixel location. The callback function typically takes the feature as its first argument and an optional second argument for the layer the feature belongs to. In the callback we can assign the feature of the Vectortile to the variables we are displaying on the map.
Aggregating over the extent
Last but not least, we will do some aggregation on the data that is currently displayed in the window. We will display the number of buildings of a specific type that are displayed in the current extent. Therfore we need to add another section to the sidebar:
<h2>Buildings in View</h2>
<li class="no-bullet">Number of Buildings: </li>
<li class="no-bullet">Number of Retail Buildings: </li>
<li class="no-bullet">Number of Industrial Buildings: </li>
We can extract the numberOfBuildings by doing the following:
map.on('moveend', function(evt) {
numberOfBuildings.value = 0;
numberOfIndustrialBuildings.value = 0;
numberOfRetailBuildings.value = 0;
let extent = map.getView().calculateExtent(map.getSize());
const source = vtLayer.getSource();
if (source) {
const features = source.getFeaturesInExtent(extent);
features.forEach((feature) => {
if (feature.get('building') === 'retail') {
numberOfRetailBuildings.value += 1;
}
else if (feature.get('building') === 'industrial') {
numberOfIndustrialBuildings.value += 1;
}
});
numberOfBuildings.value = features.length;
data.value.datasets[0].data = [
numberOfBuildings.value,
numberOfRetailBuildings.value,
numberOfIndustrialBuildings.value
]
console.log(data.value.datasets[0])
}
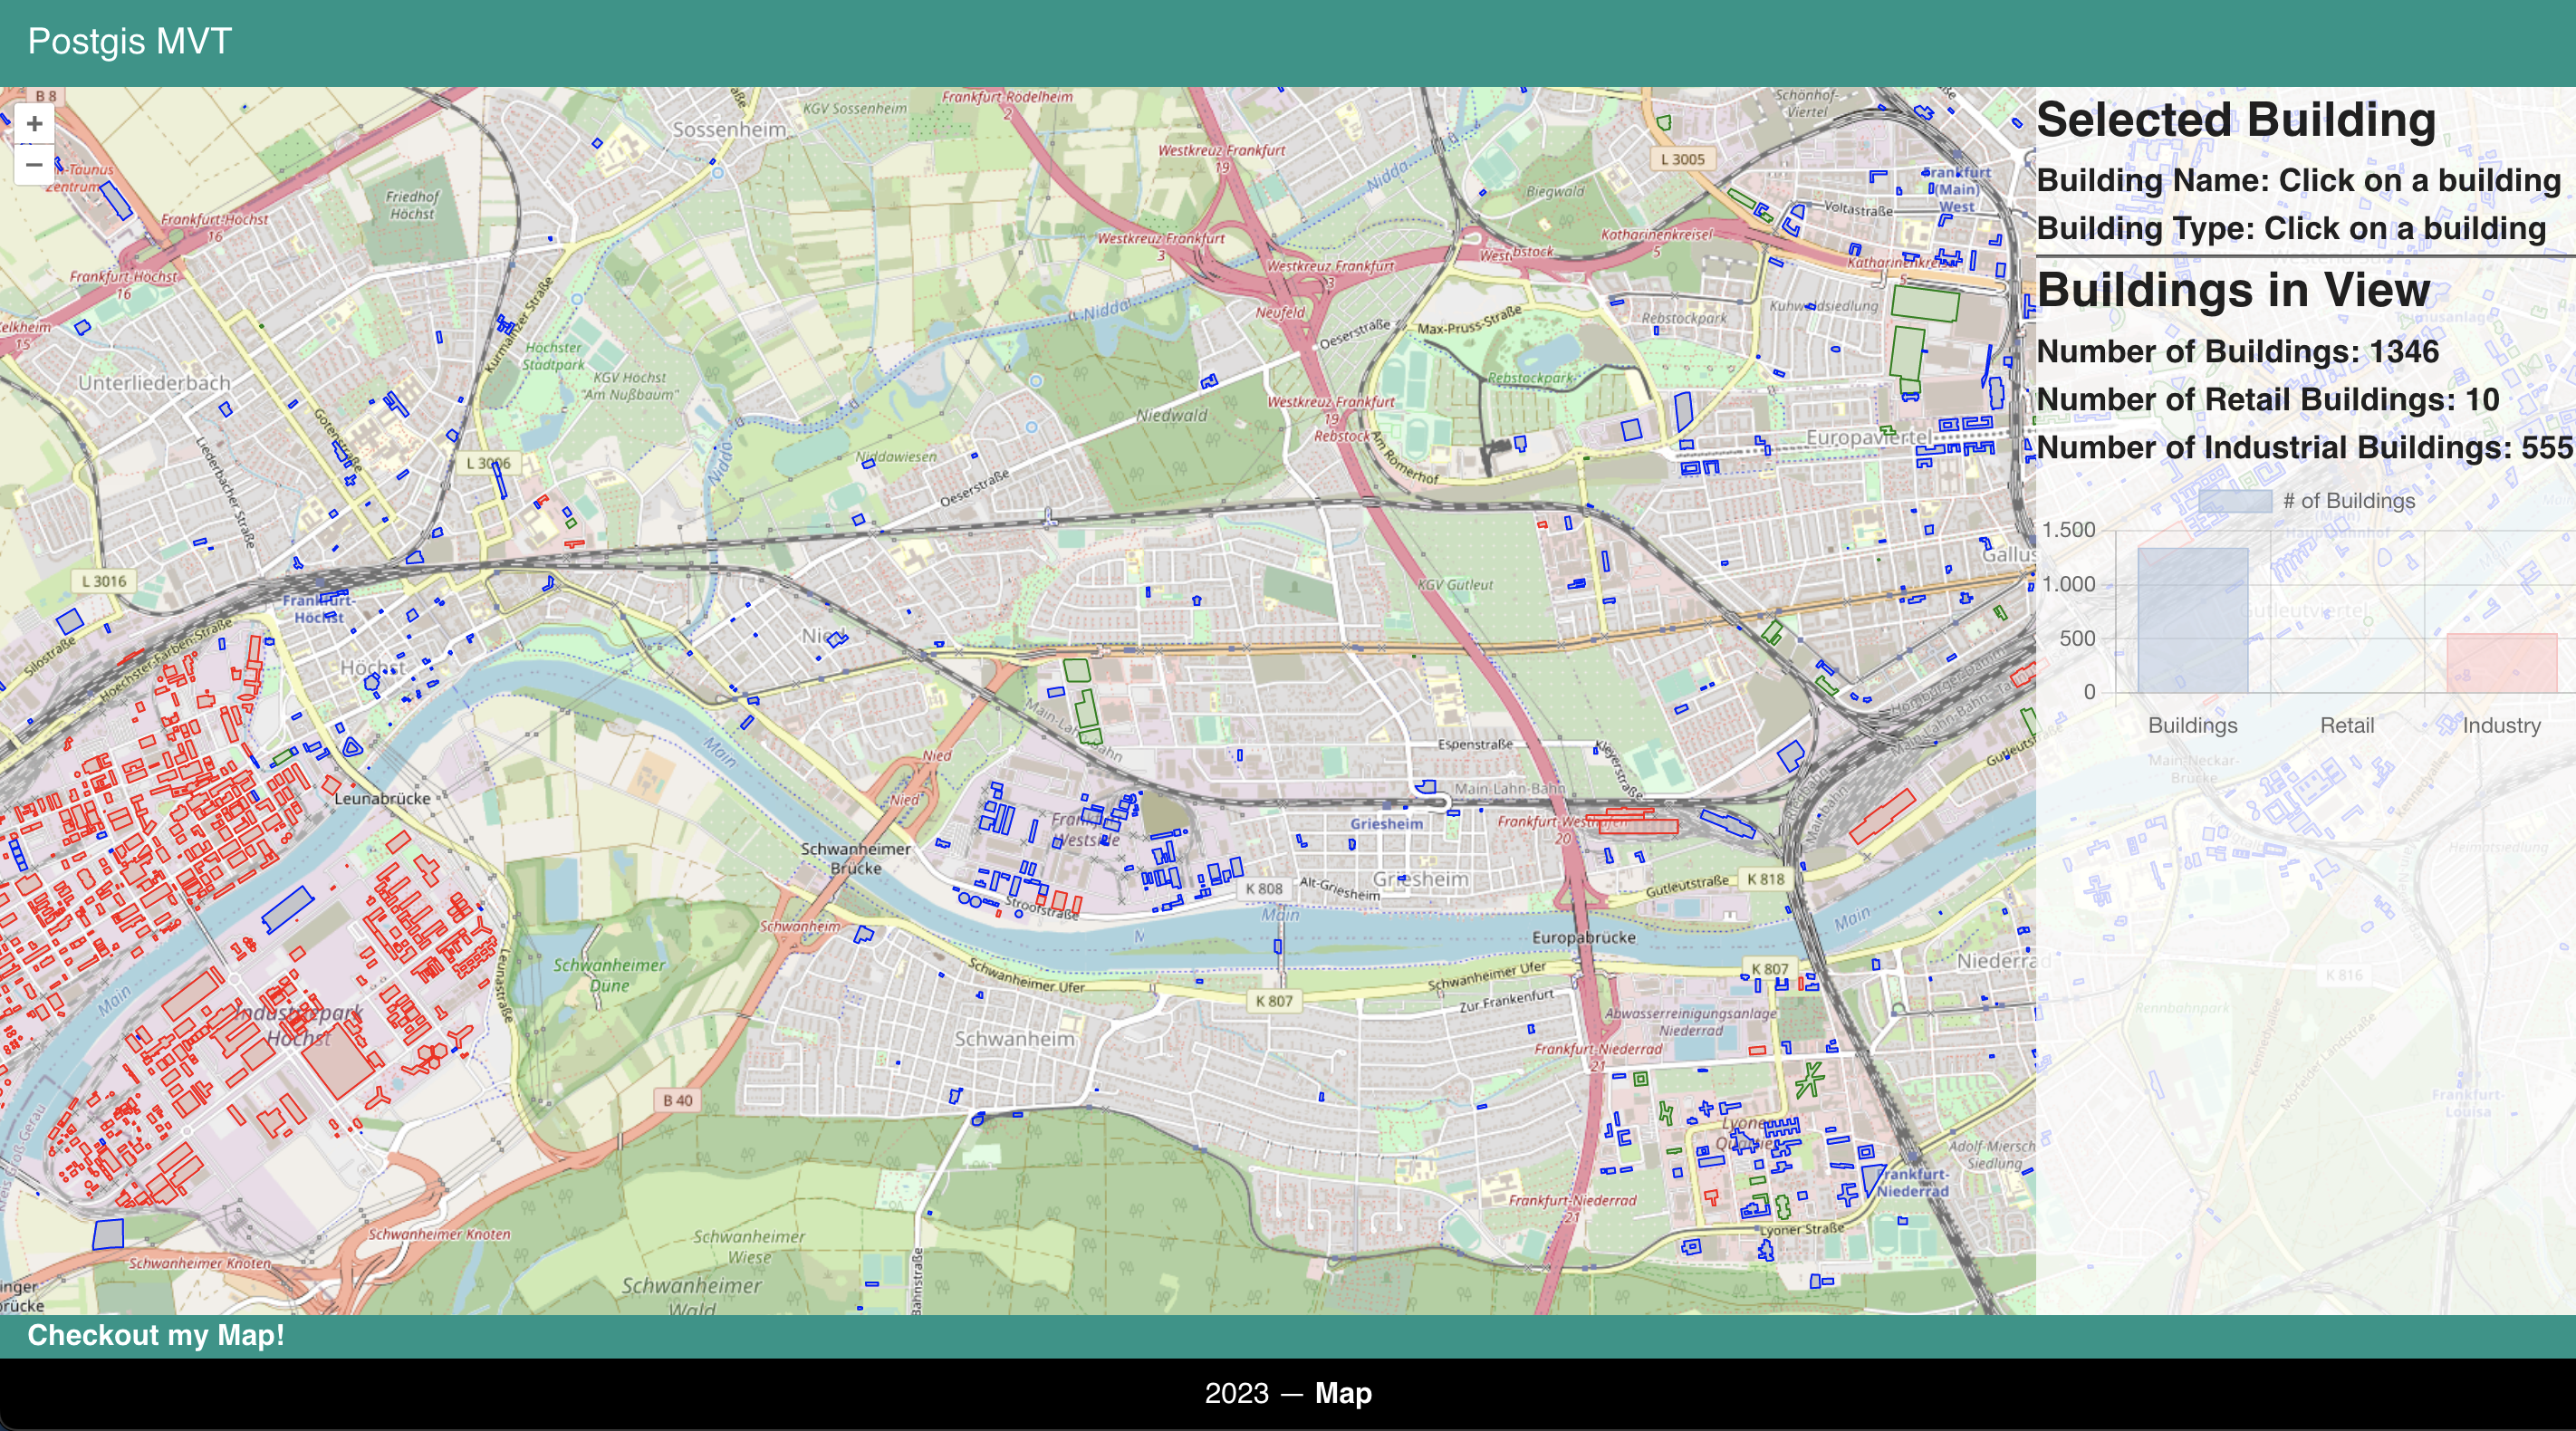
})More or less analogously to the onClick Event, we can extract the features of the Vectortiles. Here we are utilizing the moveend event that is triggerd whenever the map view has finished changing due to user interactions or programmatically invoked actions, such as panning or zooming. This time we extract the features with getFeaturesInExtent and iterate over all features returned. The numberOfBuildings can be generated while in the loop. We can calculate the extent by using map.getView().calculateExtent(map.getSize());. The result is the full number of buildings in the extent, seperated by their building property.
To have a little bit more fun I also added a barchart, that shows these numbers in a more shiny manner. The result should look like this:
Wrapup
In this post, we have explored various aspects of enhancing interactive mapping applications using Postgis Vectortiles and OpenLayers. We looked into basic styling options, click events and how to aggregate the while extent interactively. Feel free to checkout the code here.
Hope you enjoyed it. Until next time, have nice day. 👋